سلام دوستان
امیدوارم حالتون خوب باشه
چند تا آموزش مقدماتی اکسل واستون به زبان انگلیسی میزارم امیدوارم بهره ببرید
1 : آموزش ساخت نمودار Stock
In general, a stock table includes the stock insurance date, the stock volume, stock opening price, closing price, the highest price and the lowest price just like the below screenshot shown.
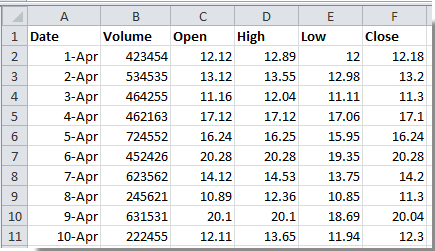
In this case, you need to create the Volume-Open-High-Low-Close stock chart.
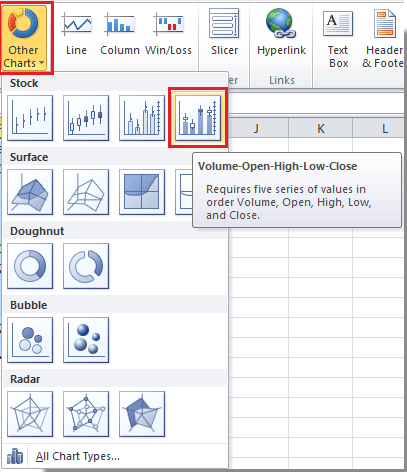
1. Select the data range, then click Insert > Other Charts > Volume-Open-High-Low-Close stock chart. See screenshot:
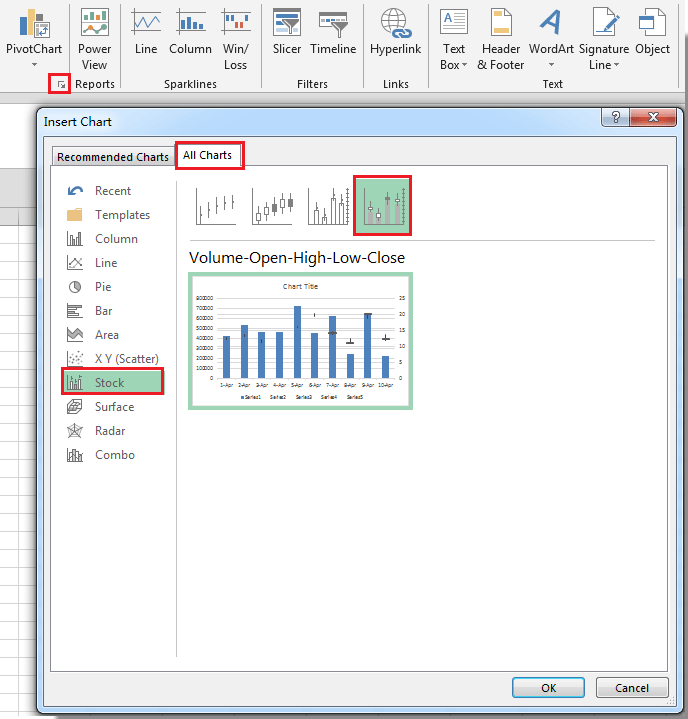
Tip: In Excel 2013, click Insert > See All Charts arrow, then in the Insert Chart dialog, select Stock > Volume-Open-High-Low-Close stock chart under All Charts tab, and click OK to close this dialog. See screenshot:
2. Now a stock chart including all stock data is inserted in Excel. See screenshot:
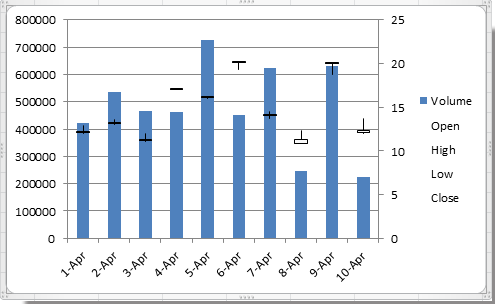
In the default chart layout, the series are overlapped. For better viewing the data, you can format the chart Y axis.
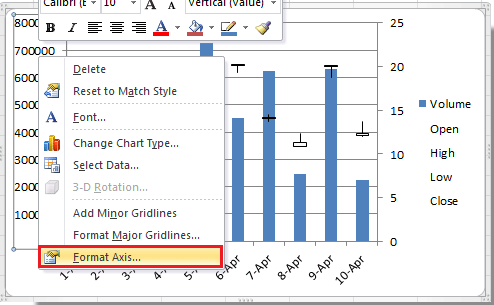
3. Right click at the Y axis, and select Format Axis option from context menu. See screenshot:
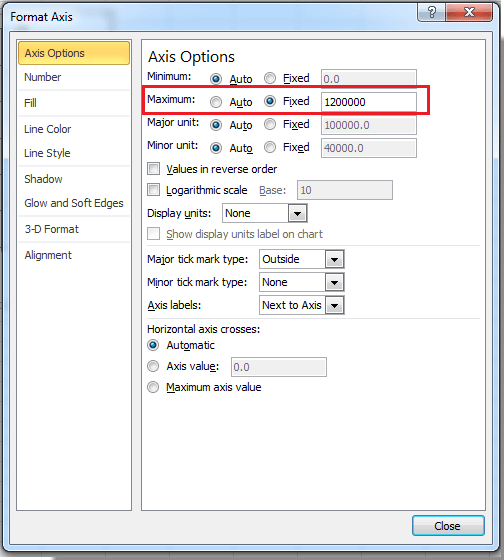
4. In the Format Axis dialog, check Fixed option of the Maximum, and type the larger number into the text box until the data in chart do not overlap. See screenshot:
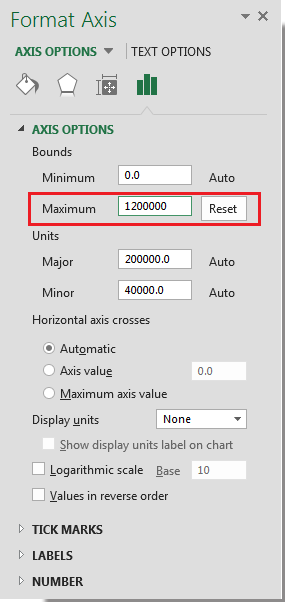
Tip: In Excel 2013, reset the Maximum value in the Format Axis pane. See screenshot:
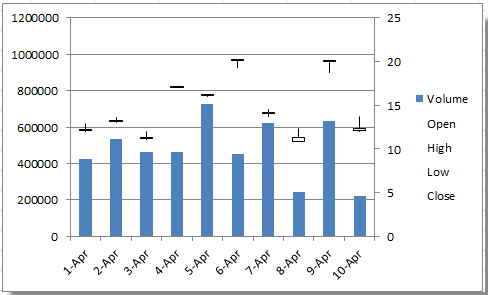
5. Close dialog. Now you can see the stock chart shown as below:
Tip: There are four types of stock charts in Excel, you can create a suitable stock chart as you need.


 اعداد در اکسل")

")


